A function to make the work with the functional development profiles within run-off triangles more easy and straightforward—particularly when vizualizing the functional profiles (observed, completed, or both simultaneously) in a single plot
Value
an object of the class profileLadder which is a list with the
following elements:
- reserve
basic summary of the run-off triangle and the predicted/true reserve (if it is available otherwise
NAvalues are provided instead)- method
type of the printed triangle (either a run-off triangle itself if no prediction method is applied or the completed triangle where the missing fragments are imputed by one of the algorithm, PARALLAX, REACT, or MACRAME)
- Triangle
input (triangular shaped) run-off triangle
- FullTriangle
completed development profiles imputed by using one of the estimation algorithm (i.e., PARALLAX, REACT, or MACRAME)—if applied—value
NAprovided otherwise- trueComplete
true fully developmed profiles of the run-off triangle (if available for back-testing purposes) or
NAreturned otherwise
Examples
data(CameronMutual)
print(CameronMutual)
#> dev
#> origin 1 2 3 4 5 6 7 8 9 10
#> 1 5244 9228 10823 11352 11791 12082 12120 12199 12215 12215
#> 2 5984 9939 11725 12346 12746 12909 13034 13109 13113 13115
#> 3 7452 12421 14171 14752 15066 15354 15637 15720 15744 15786
#> 4 7115 11117 12488 13274 13662 13859 13872 13935 13973 13972
#> 5 5753 8969 9917 10697 11135 11282 11255 11331 11332 11354
#> 6 3937 6524 7989 8543 8757 8901 9013 9012 9046 9164
#> 7 5127 8212 8976 9325 9718 9795 9833 9885 9816 9815
#> 8 5046 8006 8984 9633 10102 10166 10261 10252 10252 10252
#> 9 5129 8202 9185 9681 9951 10033 10133 10182 10182 10183
#> 10 3689 6043 6789 7089 7164 7197 7253 7267 7266 7266
#> attr(,"class")
#> [1] "triangle" "matrix"
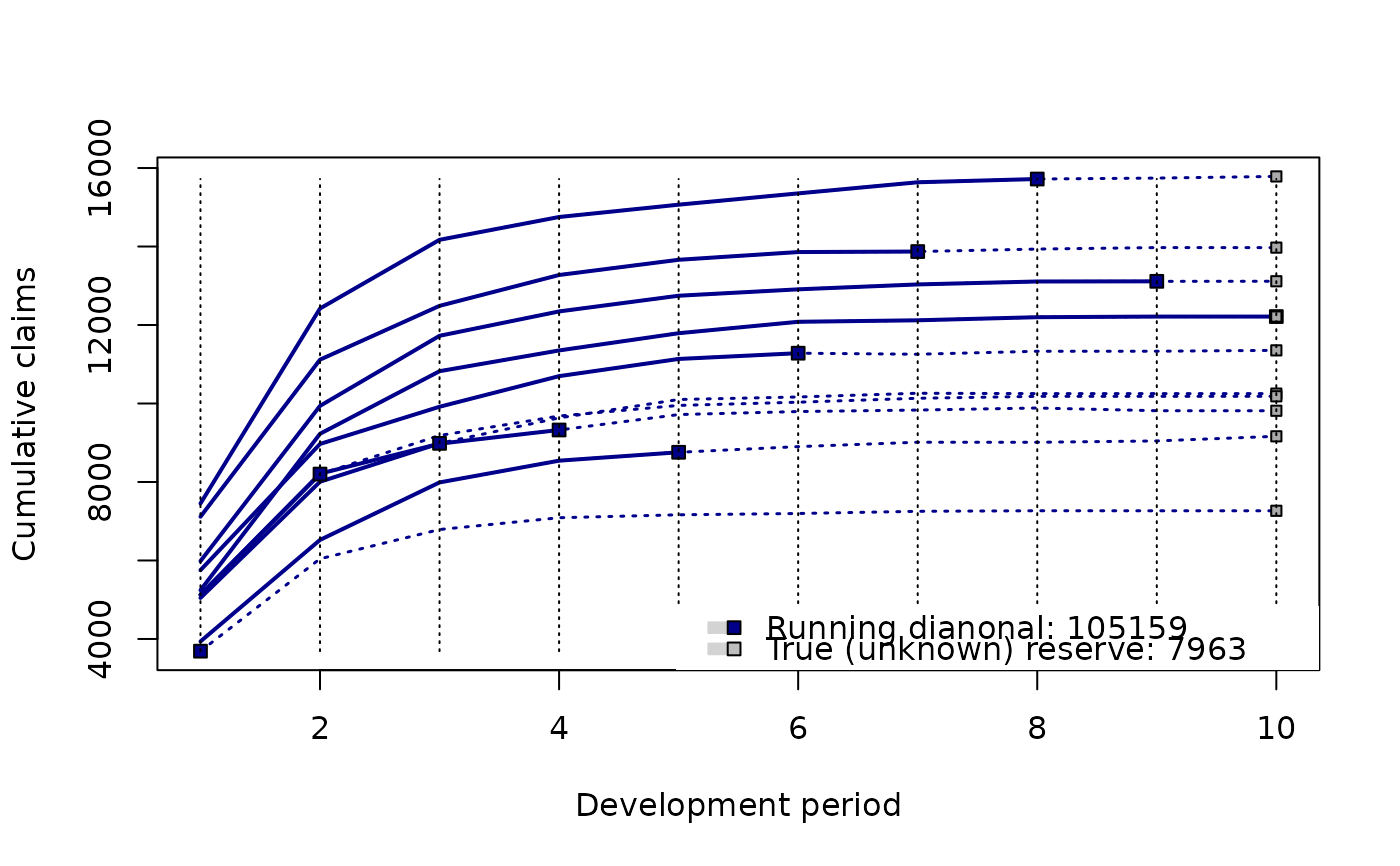
x <- as.profileLadder(CameronMutual)
print(x)
#> Run-off Reserving
#> Estimated Reserve Estimated Ultimate Paid Amount
#> NA NA 105159
#> True Reserve
#> 7963
#>
#> Run-off triangle (complete/fully observed)
#> 5244 9228 10823 11352 11791 12082 12120 12199 12215 12215
#> 5984 9939 11725 12346 12746 12909 13034 13109 13113 13115
#> 7452 12421 14171 14752 15066 15354 15637 15720 15744 15786
#> 7115 11117 12488 13274 13662 13859 13872 13935 13973 13972
#> 5753 8969 9917 10697 11135 11282 11255 11331 11332 11354
#> 3937 6524 7989 8543 8757 8901 9013 9012 9046 9164
#> 5127 8212 8976 9325 9718 9795 9833 9885 9816 9815
#> 5046 8006 8984 9633 10102 10166 10261 10252 10252 10252
#> 5129 8202 9185 9681 9951 10033 10133 10182 10182 10183
#> 3689 6043 6789 7089 7164 7197 7253 7267 7266 7266
plot(x)