Visualization of the Run-Off Triangle Increments for the Markov Chain
Source:R/plot.mcSetup.R
plot.mcSetup.RdThe function provides a graphical visualization of the results obtained from
the incrExplor() function. In particular, the considered run-off triangle
increments are distributed into the bins according the given Markov chain breaks
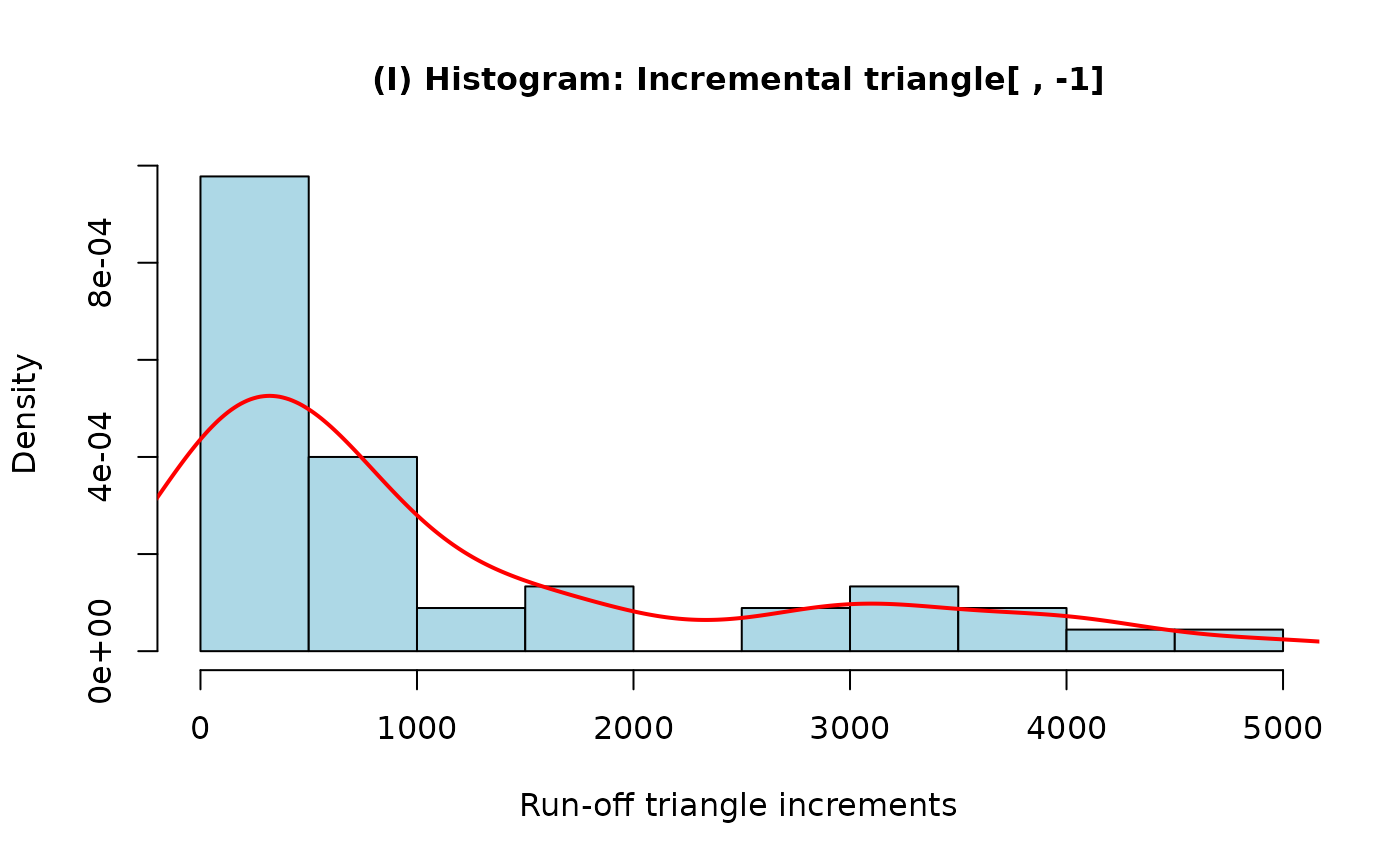
and states. Two figures are provided: The first figure contains a histogram
of the standard incremental residuals with a conrresponding kernel density
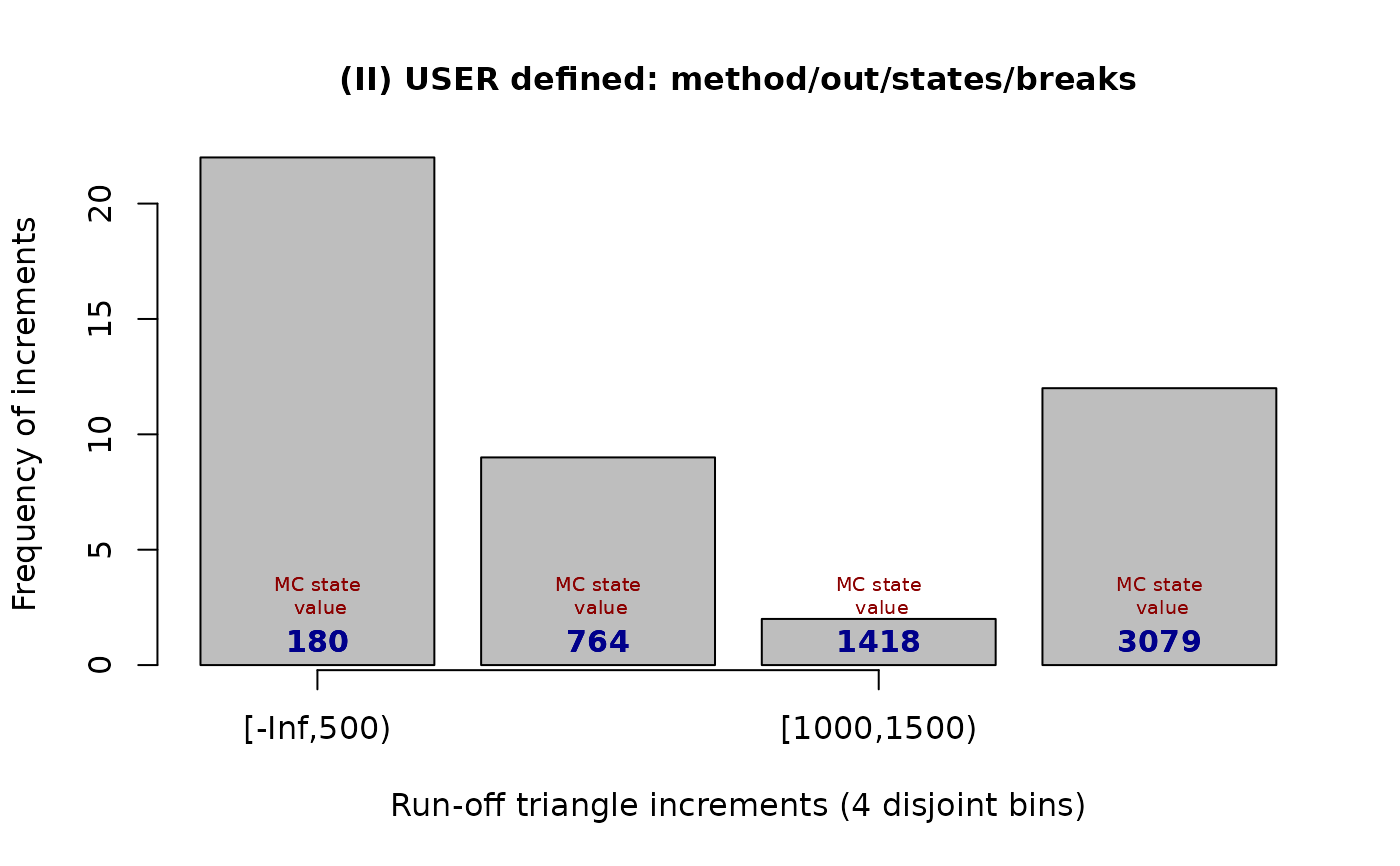
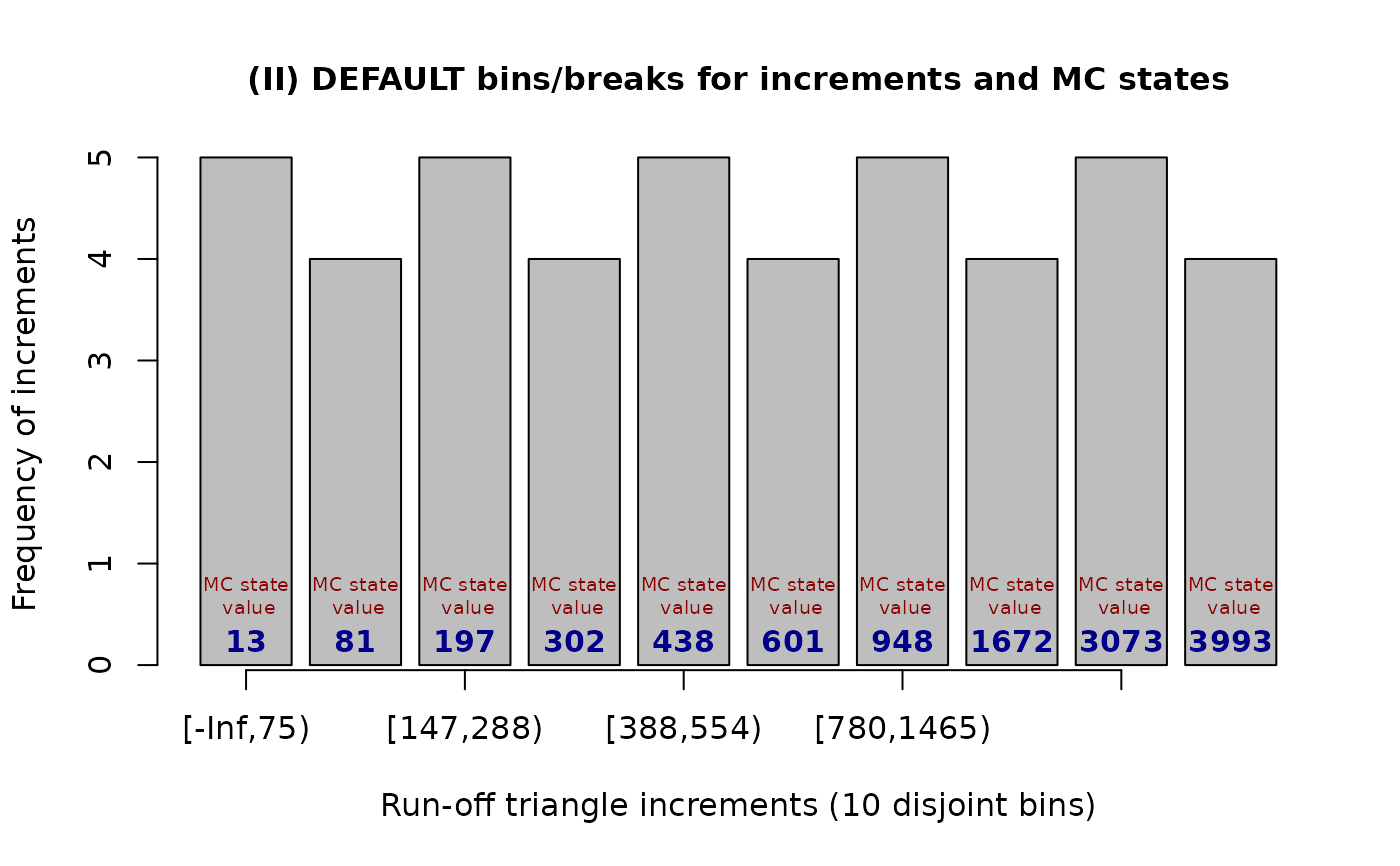
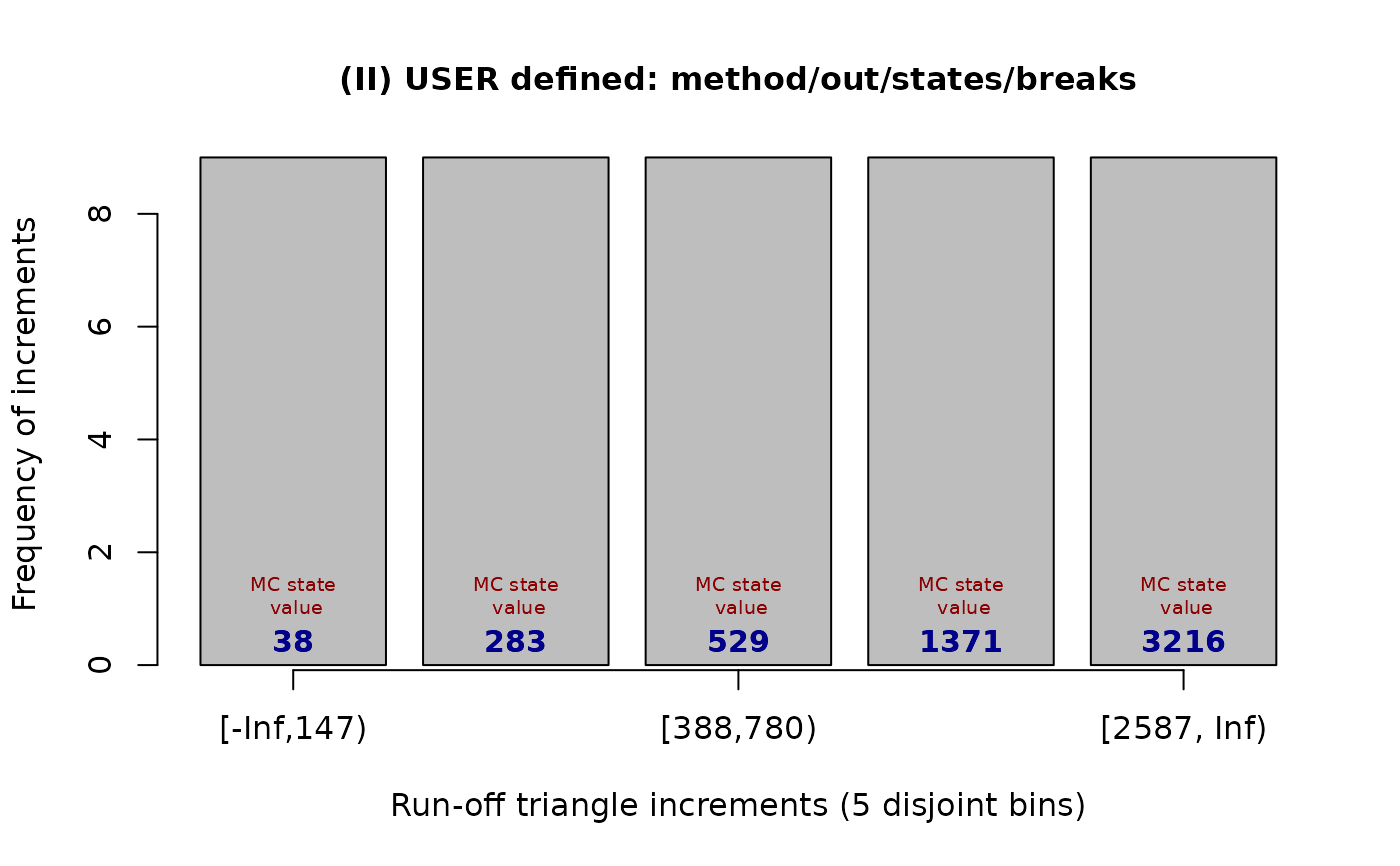
estimate. The second figure shows how the increments are distributed into the
given set of bins (defined by the break points). In addition, the corresponding
Markov chain states are displayed
Usage
# S3 method for class 'mcSetup'
plot(x, ...)
Arguments
- x
an object of the class
mcSetup– i.e., the output of theincrExplor()function- ...
other graphical parameters to plot
Value
The function returns a layout with two plots: A histogram with the run-off triangle increments and the barplot with the increments being distributed into the given set of bins
Examples
## run-off triangle increments within the default bins
x <- incrExplor(CameronMutual)
plot(x)
 ## run-off triangle increments and user-defined number of bins
x <- incrExplor(CameronMutual, states = 5)
plot(x)
## run-off triangle increments and user-defined number of bins
x <- incrExplor(CameronMutual, states = 5)
plot(x)

 ## run-off triangle increments within the user-specified bins
x <- incrExplor(CameronMutual, breaks = c(500, 1000, 1500))
plot(x)
## run-off triangle increments within the user-specified bins
x <- incrExplor(CameronMutual, breaks = c(500, 1000, 1500))
plot(x)